> ## Documentation Index
> Fetch the complete documentation index at: https://agentcommunicationprotocol.dev/llms.txt
> Use this file to discover all available pages before exploring further.
# Debug
> Use OpenTelemetry instrumentation for debugging
Debugging distributed agent systems requires visibility into how requests flow between agents, where bottlenecks occur, and how decisions are made. This section will demonstrate how to use the OpenTelemetry instrumentation for debugging. You'll learn how to enable instrumentation for ACP communication and the custom agent and how to debug data in the [OTLP exporters UI](https://opentelemetry.io/docs/languages/js/exporters/#otlp).
## Why Observability Matters for Agent Systems
Debugging modern agentic systems and distributed applications can be tricky, especially when you're dealing with asynchronous workflows, multiple services, and custom logic layers. OpenTelemetry offers a powerful way to trace and understand these systems in real time. By instrumenting both the ACP communication and agent logic, you gain visibility into how data flows, how decisions are made, and where bottlenecks or errors might occur.
This section demonstrates how to capture and visualize traces using both general-purpose and AI-focused OTLP exporters, so you can debug effectively and with confidence.
## What is OTLP exporter
In the context of the OpenTelemetry framework, an OTLP exporter acts as both a backend for data collection and a **UI** for data visualisation.
We'll review options:
* [Jaeger](https://www.jaegertracing.io/):General purpose
* [Arize Phoenix](https://phoenix.arize.com/): Optimized for AI workloads
### Jaeger
Jaeger is Open source, distributed tracing platform OpenTelemetry data visualization. This tool has a simple base UI and allows you to see data from all spans (not just limited to agent observability).
#### Run Jaeger
```
docker run --rm \
-e COLLECTOR_ZIPKIN_HOST_PORT=:9411 \
-p 16686:16686 \
-p 4317:4317 \
-p 4318:4318 \
-p 9411:9411 \
jaegertracing/all-in-one:latest
```
> open instance on `http://localhost:16686/search` in the browser.
### Phoenix
Phoenix is an open-source AI observability platform designed for experimentation, evaluation, and troubleshooting by [Arize AI](https://arize.com/).It has its own semantic conventions that all [supported frameworks](https://arize.com/docs/ax/observe/agents/implementing-agent-metadata-for-arize) must follow. The advantage is defining more custom attributes for trace's well-visualization and evaluation.
Use Phoenix when your primary focus is agent observability.
The main disadvantage is that if the custom data atributes aren't correctly parsed then phoenix truncates them, making it not possible to debug.
> By default, Phoenix runs on port **6006**. You can either map this to the standard OTLP port **4318** or update the `OTEL_EXPORTER_OTLP_ENDPOINT` to point to the correct port.
#### Run Phoenix
```
docker run -p 4318:6006 -i -t arizephoenix/phoenix
```
> open instance on `http://localhost:4318/projects` in the browser.
## Jaeger Example for System Observability
In this example, we will focus only on the communication between the server and client using `Jaeger`.
Be sure you have a running Jaeger instance before you start! See the [Run Jaeger](#run-jaeger) section for more details.
### Init the repository
This guide uses `uv`. See the [`uv` primer](/introduction/uv-primer) for more details.
```
uv init --python '>=3.11' my_acp_project
cd my_acp_project
uv add acp-sdk
```
### Define Agent / Client
Define `agent.py`, `telemetry.py` and `client.py` files:
```python theme={null}
from acp_sdk.server import Server
from acp_sdk.models import Message
server = Server()
@server.agent()
async def echo(input: list[Message]):
for message in input:
yield message
server.run(configure_telemetry=True)
```
```python theme={null}
from opentelemetry.sdk.resources import Resource
from opentelemetry import trace
from opentelemetry.sdk.trace import TracerProvider
from opentelemetry.sdk.trace.export import BatchSpanProcessor
from opentelemetry.exporter.otlp.proto.http.trace_exporter import OTLPSpanExporter
def setup_tracer():
resource = Resource.create(attributes={
"service.name": "acp-client",
})
provider = TracerProvider(resource=resource)
processor = BatchSpanProcessor(OTLPSpanExporter())
provider.add_span_processor(processor)
trace.set_tracer_provider(provider)
```
```python theme={null}
import asyncio
from acp_sdk.client import Client
from acp_sdk.models import Message, MessagePart
from telemetry import setup_tracer
setup_tracer()
async def main():
async with Client(base_url="http://localhost:8000") as client, client.session() as session:
await session.run_sync(
agent="echo",
input=[
Message(
parts=[MessagePart(content="Howdy!", content_type="text/plain")]
)
],
)
await session.run_sync(
agent="echo",
input=[
Message(
parts=[MessagePart(content="Test 2", content_type="text/plain")]
)
],
)
if __name__ == "__main__":
asyncio.run(main())
```
Instrumentation was turned on by setting `configure_telemetry=True` in the `server.run` function of the **agent.py** file.
### Run the server
```
uv run agent.py
```
### Run the client
```
uv run client.py
```
### Debug it
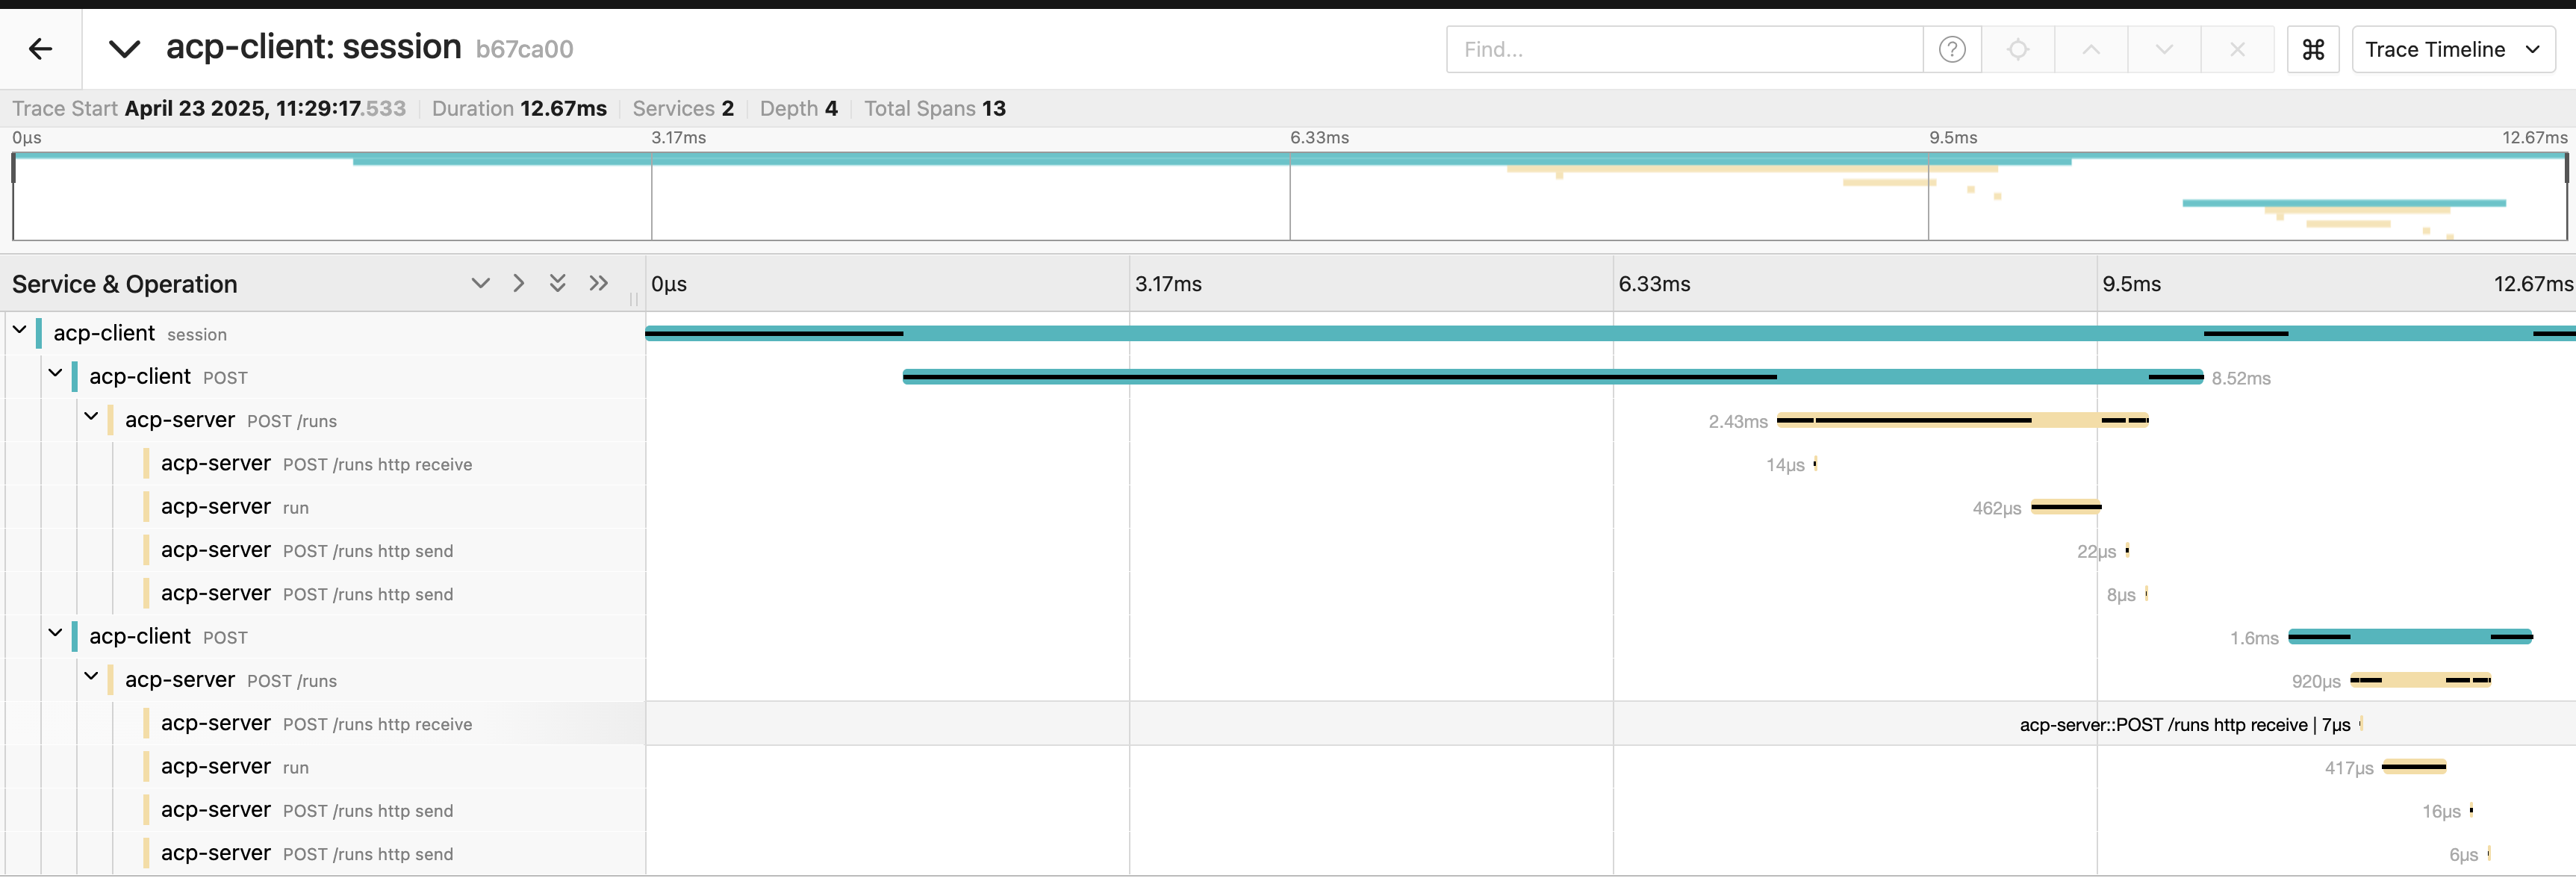
Open `http://localhost:16686/search` in your browser, select **acp-client** in the `Service` input on the left menu and click on the `Find Traces` button.
You should see your first trace. When you click on the trace, you should see the following details:
 ## Phonexix Example for Agent Observability
In this section, we will set up observability for the agents themselves using `Phoenix`.
Be sure you have a running Phoenix instance before you start! See the [Run Phoenix](#run-phoenix) section for more details.
### LangGraph Agent
#### Init repository
```
uv init
```
```
uv add acp-sdk==0.3.3 langgraph==0.3.31 openinference-instrumentation-langchain==0.1.41
```
#### Define Agent / Client
Define `agent.py`, `telemetry.py` and `client.py` files:
```python theme={null}
from collections.abc import AsyncGenerator
from functools import reduce
from datetime import datetime
from typing import TypedDict
from openinference.instrumentation.langchain import LangChainInstrumentor
from acp_sdk.models.models import MessagePart
from acp_sdk.models import Message
from acp_sdk.server import RunYield, RunYieldResume, Server
from langchain_core.runnables import RunnableLambda
from langgraph.graph import StateGraph
LangChainInstrumentor().instrument()
class AgentState(TypedDict):
name: str
final_response: str
hour: int
greeting: str
def get_current_hour(state: AgentState):
now = datetime.now()
return {"hour": now.hour}
def decide_greeting(state: AgentState):
hour = state["hour"]
if 6 <= hour < 12:
return {"greeting": "Good morning"}
elif 12 <= hour < 18:
return {"greeting": "Good afternoon"}
else:
return {"greeting": "Good evening"}
def format_response(state: AgentState):
return {"final_response": f'{state["greeting"]} {state["name"]}'}
# create graph
workflow = StateGraph(AgentState)
# add nodes
workflow.add_node("get_time", RunnableLambda(get_current_hour))
workflow.add_node("decide_greeting", RunnableLambda(decide_greeting))
workflow.add_node("format_response", RunnableLambda(format_response))
# connect nodes
workflow.set_entry_point("get_time")
workflow.add_edge("get_time", "decide_greeting")
workflow.add_edge("decide_greeting", "format_response")
workflow.set_finish_point("format_response")
graph = workflow.compile()
server = Server()
@server.agent()
async def lang_graph_agent(input: list[Message]) -> AsyncGenerator[RunYield, RunYieldResume]:
"""LangGraph agent that greets the user based on the current time."""
query = reduce(lambda x, y: x + y, input)
output = None
async for event in graph.astream({"name": str(query)}, stream_mode="updates"):
for value in event.items():
yield {"update": value}
output = event
yield MessagePart(content=output.get("format_response", {}).get("final_response", ""), content_type="text/plain")
server.run(configure_telemetry=True)
```
```python theme={null}
from opentelemetry.sdk.resources import Resource
from opentelemetry import trace
from opentelemetry.sdk.trace import TracerProvider
from opentelemetry.sdk.trace.export import BatchSpanProcessor
from opentelemetry.exporter.otlp.proto.http.trace_exporter import OTLPSpanExporter
def setup_tracer():
resource = Resource.create(attributes={
"service.name": "acp-client",
})
provider = TracerProvider(resource=resource)
processor = BatchSpanProcessor(OTLPSpanExporter())
provider.add_span_processor(processor)
trace.set_tracer_provider(provider)
```
```python theme={null}
import asyncio
from acp_sdk.client import Client
from acp_sdk.models import (
Message,
MessagePart,
)
from telemetry import setup_tracer
setup_tracer()
async def client() -> None:
async with Client(base_url="http://localhost:8000") as client, client.session() as session:
run_milan = await session.run_sync(
agent="lang_graph_agent",
input=[Message(parts=[MessagePart(content="Milan", content_type="text/plain")])]
)
print(run_milan.output[0].parts[0].content)
if __name__ == "__main__":
asyncio.run(client())
```
Notice the `LangChainInstrumentor().instrument()` line when we turn on the LangChain instrumentation (LangGraph included) in the **agent.py** file.
#### Run the server
```
uv run server.py
```
#### Run the client
```
uv run client.py
```
#### Debug it
Open `http://localhost:4318/projects` in your browser and choose the **default** project.
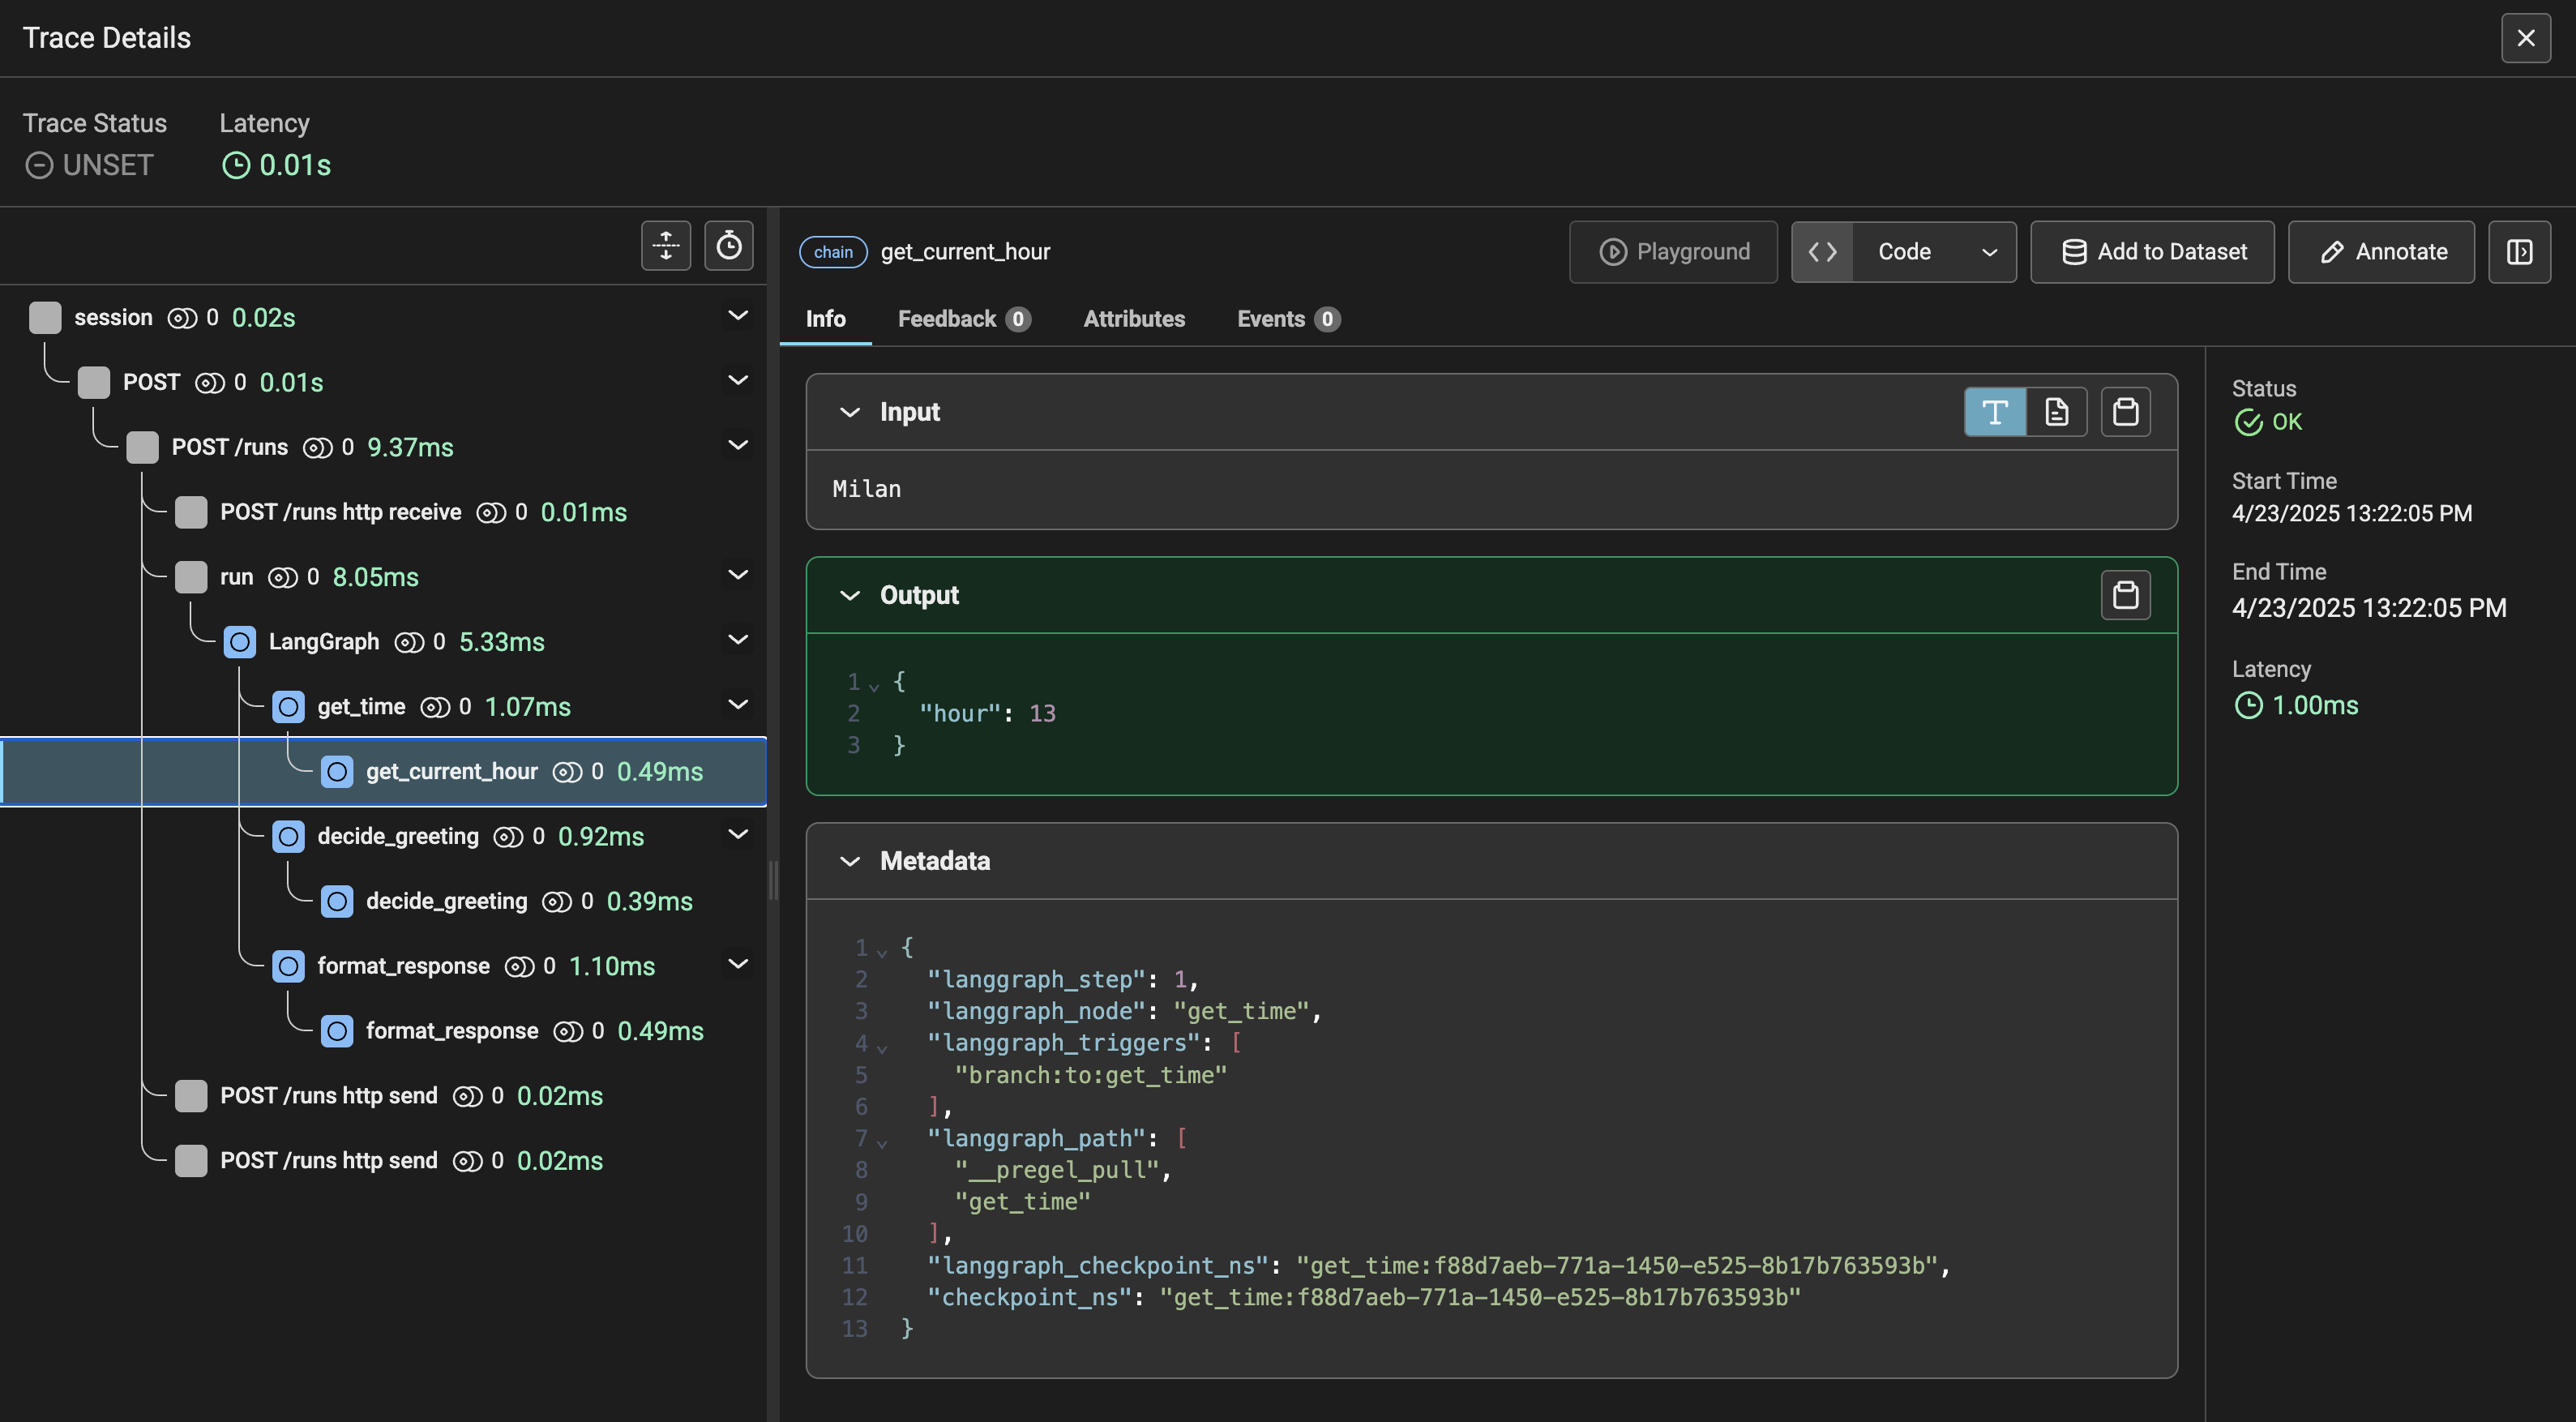
You should see your first trace called `session`. When you click on the trace, you should see these details:
## Phonexix Example for Agent Observability
In this section, we will set up observability for the agents themselves using `Phoenix`.
Be sure you have a running Phoenix instance before you start! See the [Run Phoenix](#run-phoenix) section for more details.
### LangGraph Agent
#### Init repository
```
uv init
```
```
uv add acp-sdk==0.3.3 langgraph==0.3.31 openinference-instrumentation-langchain==0.1.41
```
#### Define Agent / Client
Define `agent.py`, `telemetry.py` and `client.py` files:
```python theme={null}
from collections.abc import AsyncGenerator
from functools import reduce
from datetime import datetime
from typing import TypedDict
from openinference.instrumentation.langchain import LangChainInstrumentor
from acp_sdk.models.models import MessagePart
from acp_sdk.models import Message
from acp_sdk.server import RunYield, RunYieldResume, Server
from langchain_core.runnables import RunnableLambda
from langgraph.graph import StateGraph
LangChainInstrumentor().instrument()
class AgentState(TypedDict):
name: str
final_response: str
hour: int
greeting: str
def get_current_hour(state: AgentState):
now = datetime.now()
return {"hour": now.hour}
def decide_greeting(state: AgentState):
hour = state["hour"]
if 6 <= hour < 12:
return {"greeting": "Good morning"}
elif 12 <= hour < 18:
return {"greeting": "Good afternoon"}
else:
return {"greeting": "Good evening"}
def format_response(state: AgentState):
return {"final_response": f'{state["greeting"]} {state["name"]}'}
# create graph
workflow = StateGraph(AgentState)
# add nodes
workflow.add_node("get_time", RunnableLambda(get_current_hour))
workflow.add_node("decide_greeting", RunnableLambda(decide_greeting))
workflow.add_node("format_response", RunnableLambda(format_response))
# connect nodes
workflow.set_entry_point("get_time")
workflow.add_edge("get_time", "decide_greeting")
workflow.add_edge("decide_greeting", "format_response")
workflow.set_finish_point("format_response")
graph = workflow.compile()
server = Server()
@server.agent()
async def lang_graph_agent(input: list[Message]) -> AsyncGenerator[RunYield, RunYieldResume]:
"""LangGraph agent that greets the user based on the current time."""
query = reduce(lambda x, y: x + y, input)
output = None
async for event in graph.astream({"name": str(query)}, stream_mode="updates"):
for value in event.items():
yield {"update": value}
output = event
yield MessagePart(content=output.get("format_response", {}).get("final_response", ""), content_type="text/plain")
server.run(configure_telemetry=True)
```
```python theme={null}
from opentelemetry.sdk.resources import Resource
from opentelemetry import trace
from opentelemetry.sdk.trace import TracerProvider
from opentelemetry.sdk.trace.export import BatchSpanProcessor
from opentelemetry.exporter.otlp.proto.http.trace_exporter import OTLPSpanExporter
def setup_tracer():
resource = Resource.create(attributes={
"service.name": "acp-client",
})
provider = TracerProvider(resource=resource)
processor = BatchSpanProcessor(OTLPSpanExporter())
provider.add_span_processor(processor)
trace.set_tracer_provider(provider)
```
```python theme={null}
import asyncio
from acp_sdk.client import Client
from acp_sdk.models import (
Message,
MessagePart,
)
from telemetry import setup_tracer
setup_tracer()
async def client() -> None:
async with Client(base_url="http://localhost:8000") as client, client.session() as session:
run_milan = await session.run_sync(
agent="lang_graph_agent",
input=[Message(parts=[MessagePart(content="Milan", content_type="text/plain")])]
)
print(run_milan.output[0].parts[0].content)
if __name__ == "__main__":
asyncio.run(client())
```
Notice the `LangChainInstrumentor().instrument()` line when we turn on the LangChain instrumentation (LangGraph included) in the **agent.py** file.
#### Run the server
```
uv run server.py
```
#### Run the client
```
uv run client.py
```
#### Debug it
Open `http://localhost:4318/projects` in your browser and choose the **default** project.
You should see your first trace called `session`. When you click on the trace, you should see these details: